Tracking Performance in Excel
The ability to measure performance in Microsoft Project is a key element to keeping a project on track. Saving a baseline for a project where your using Microsoft Project is pretty easy to do. but that doesn’t necessarily tell you how on-time tasks are tracking.
Although often overused, misused and poorly managed, the concept of “traffic lights” to gauge performance (green=good, yellow=problems, red=bad) can give you a sense of “how’s it going” when a baseline shows you to be on track. But how do you implement something like that, as “Progress” is not a standard field in Microsoft Project.
Create a Custom Field In this example, I’m using Microsoft Project 2010. If you’re using another version, the instructions may be different, but the functionality should still be there.
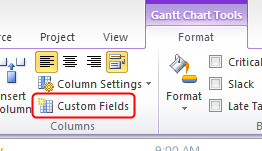
Select Gantt Chart Tools > Columns > Custom Fields:
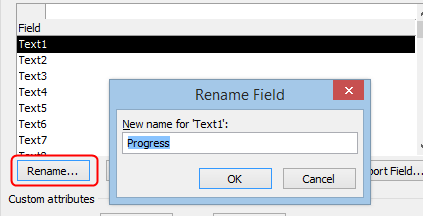
Select the Text field you want to use (making sure not to use a Text field already used for another function), and select Rename, and give it a name such as Progress:
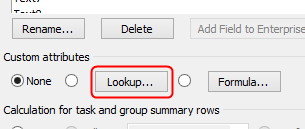
Next, select the Lookup button from the Custom Attributes field:
Then enter the values you want in your custom field, as an example, I’m using “On Track, Slipping & Blocked”:
Then select Close. Next select the Graphical Indicators button:

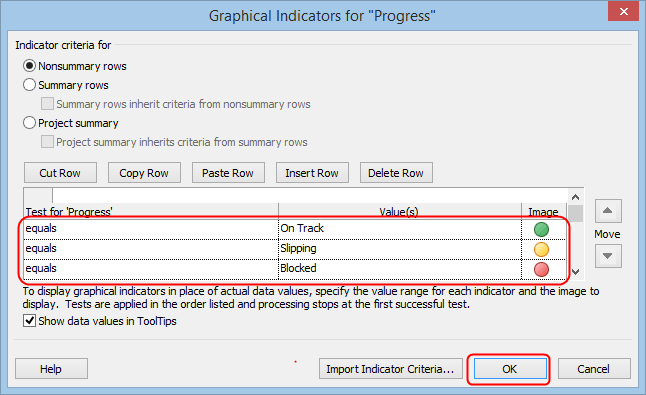
In the Graphical Indicators Selector screen that appears, first make sure that Nonsummary rows are selected for the criteria:
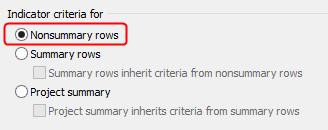
I’m looking to track progress on specific tasks, not on a group of tasks. You’ll need to define the “test” for each of the custom values we created earlier. In this case, the test is “equals”.
Next, select the customer value created earlier from the Values dropdown:
and then select the your prefered image:
Once you’ve completed this for each of the custom values, select OK (and OK again to return to your Gantt chart):
Once your back in your project schedule, select Add New Column:
then select the progress field we created earlier:
Now, as you manage your project, you can use your new Progress field for each of the tasks in your schedule:
Once you select the Progress value, the graphical indicator will appear:
If you export project schedule information to Excel, the graphical images wont copy over, but you can use a conditional formatting rule to get the desired results.